
Key Concepts Study Tool: Chapter 06
Click on each concept below to check your understanding.
1. Measures of Central Tendency
- Describes “typical” observations in your data set. These measures include the arithmetic mean, the median, and the mode. The appropriate measure of central tendency to report depends upon the level of measurement of your variable (i.e., nominal, ordinal, interval, or ratio).
2. Mode
- Most frequently occurring value of a variable of interest in the data set.
- Can be used with any level of measurement but most commonly reported for nominal and ordinal data (the only measure of central tendency that can be reported for nominal data).
3. Median
- When X values are ordered it is the value that falls exactly in the middle.
- Often when data are normally distributed the mean and median will be found to have the same value.
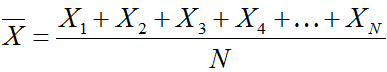
4. Mean
- Arithmetic average and the most commonly used measure of central tendency.
- Can only be calculated for variables at the interval/ratio level of measurement.
- Extreme values (very low or very high) will likely have an impact on the mean.
- When you have extremely high values the median will be lower than the mean.
- When you have extremely low values the median will be higher than the mean.
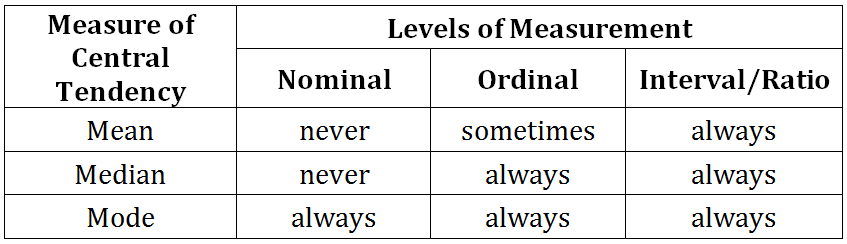
5. When to use which Measure of Central Tendency
6. Measures of Variability
- Range is the lowest value subtracted from the highest value: Range = H – L
- The Interquartile Range (IQR) shows where the middle 50% of observations lie. It is calculated by subtracting the value of the 25th quartile (Q1) from the 75th quartile (Q3): IQR = Q3 – Q1.
- The range and the IQR can be calculated for variables at the ordinal level of measurement or higher.
- Mean Deviation is the method of determining how an observation ranks in the sample, and the dispersion of values for a variable.
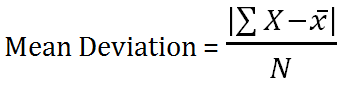
7. The Steps: Mean Deviation
- The mean deviation for any sample can be easily obtained:
- Subtract the mean from each value.
- Sum the absolute values.
- Divide the sum by the number of observations in your sample. This is the mean deviation.
8. Variance and Standard Deviation
- Variance and standard deviation measure the average distance a person is from the mean.
- Variance: the average squared distance from the mean value.
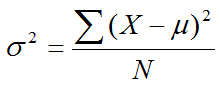
- Where μ = the population mean
- Standard Deviation: the square root of the variance.
- The variance and standard deviation can only be calculated for interval/ratio level variables, as a mean is required in the calculation.
9. The Steps: Variance and the Standard Deviation
- The variance for any sample can be obtained by:
- Subtracting the mean from each value.
- Squaring the differences calculated in step 1.
- Adding the squared deviations together.
- Dividing the sum by the number of observations in your sample.
- To get the sample standard deviation, take the square root of the variance.