
Key Concepts Study Tool: Chapter 07
Click on each concept below to check your understanding.
1. How the Standard Deviation Relates to the Normal Curve
- The standard deviation (σ) is a unit of measurement that follows an already-known continuum, the normal curve.
- The standard deviation and standard score are used to determine the rank of an observation
- It is possible to compare two observations to each other by using standard deviation scores.
- Using the mean and standard deviation, the normal curve provides information about the characteristics of a variable.
2. Normal Distribution
- The standard deviation shows what proportion of the sample, or population, lies along the normal curve on either side of certain key values.
- Based on the central limit theorem, we know:
- 68.26 per cent of all observations lie between ± 1σ from the mean.
- 95.44 per cent of all observations can be found between ±2 σ from the mean.
- 99.74 per cent lie between ±3 σ from the mean.
3. Standardizing Distributions
- The mean is given a value of zero.
- Values higher than the mean are positioned to the right of zero, and lower are to the left as negative values.
- The numbers across the horizontal axis don’t refer to the number to the specific values of your variable, but instead to the values of the variable expressed in standard deviation units.
- The y-axis is the fraction of experiments.
4. The Standard Score
- The standard score allows you to compare a single score with those of the population of interest.
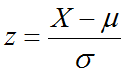
- The equation for a population:
- The equation for a sample:
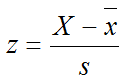
- Where:
- z = the z or standard score (expressed in standard deviations)
- X = an individual’s raw score
- μ = population mean
- x̄ = sample mean
- σ = population standard deviation
- s = sample standard deviation.
- The standard score, or z-score, is interpreted as a standard deviation, where the sum and mean are 0.
- Converting raw scores to z-scores makes it possible to determine the rank of any score, expressed in percentiles.
- We use a z-table (area under the curve) to convert z-scores to percentiles.