
Key Concepts Study Tool: Chapter 14
Click on each concept below to check your understanding.
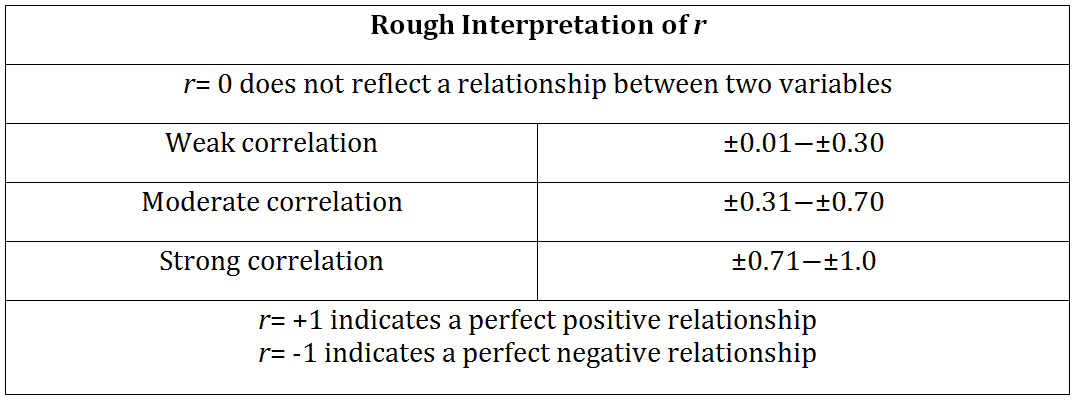
1. Pearson’s r: The Correlation Coefficient
- Measures the amount of change in Y produced by a unit change in X, where the units are expressed as standard deviations
2. How to Calculate Pearson’s r
- Using a spreadsheet program, square each value of the independent variable X.
- Square each value of the dependent variable Y.
- Find X*Y for each observation.
- Sum X, Y, the squared values of X and Y, and the XY product.
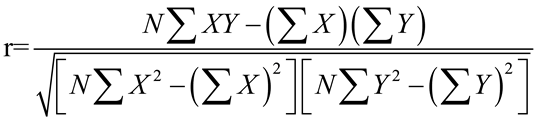
- Pearson’s r can be solved using the following equation:
3. Explained Variance (r2)
- Calculated by squaring Pearson’s r, and refers to the percentage that errors are reduced by, when the information found in the independent variable is incorporated into the prediction of the dependent variable.
- Explained variation: how much more accurate a prediction becomes when the independent variable, X, is taken into account.
- Unexplained variation: the remaining prediction error, which could be due to variables that weren’t included as predictors, measurement error, or random error.
- Total variation: the sum of the explained variation and unexplained variation in a dependent variable.
4. The Correlation Matrix
- Used to show correlations between variables and all of the possible relationships between variables in a grid
- Typically presents a series of numbers in a triangular pattern. Each cell represents the correlation between the variables that are listed above, and to the left of, the number.
- A correlation matrix can contain as many relevant variables as you can imagine. It shows the bivariate relationships among each set of two variables.
5. Using a t-Test to Assess the Significance of r
- By mathematically manipulating r, we can use the t-distributions to assess its representativeness.
- The first step is to select the appropriate t-distribution by using df=n–2, to obtain tcritical.
- The other value we need to calculate is tobserved, which is done using this formula:
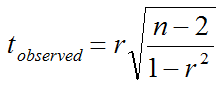
- If our calculated tobserved exceeds tcritical we can be confident that our sample r value did not occur by chance, and an association between variables exists. However, if our calculated tobserved does not exceed tcritical then we cannot be confident that the sample r value did not occur by chance.